I know it has been a while since my last blog, but here I am to keep you guys updated on my exciting journey as a 2018 NEWT REU! In the previous week, we had tested the functionalized silver membrane that was coated with the highest and lowest concentration (10-1, 10-5) of sulfur. This week we will begin to test a new concentration.
A little background on my project: We are using RO (reverse osmosis) membranes creating silver nano-particles and coating them with different concentrations of sodium sulfide (Na2s) to reacting to form Ag2S. The concentrations are as follows: 10-1, 10-2, 10-3, 10-4, and 10-5. We have data for the highest concentration and the lowest. We will begin to gather data for 10-3. Below, there will be a graph to represent the data gathered. However, only one trial would be included in our graph. Much variation could occur, that is why multiple trials are required. During this week, I also met Richard, also a summer researcher at ASU. He would be looking at the rate silver leaches from the sulfidized membranes. Together, we work to fictionalize the membranes. We begin by adding silver nitrate to the membrane allowing for the silver ions to react with the functional groups on the active layer of the membrane. Then, we add sodium borohydride (BH₄Na), a reducing agent, to get silver nanoparticles. We then add the different concentrations of sodium sulfide, allowing for the silver nanoparticles to be coated with the sulfur. That’s a little bit about my methods.
Below is my graph on the first trial of 10-3:
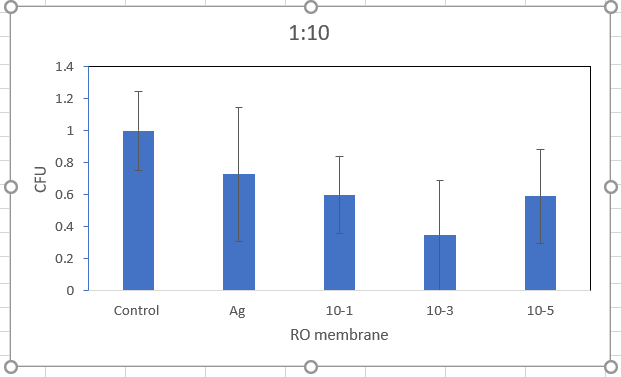
As you could see 10-3 has a high error bar. More trails are needed.
All data has been normalized to the control. This is 1:10 dilution of E. coli.
We expected less bacteria count of the silver functionalized membrane, since we know its toxicity.